)
Watcher empowers cloud administrators with Day 2 capabilities to intelligently manage workloads and optimize infrastructure. It has been an official OpenStack project for some time, but has been updated and expanded recently, adding Prometheus as a data source and enhancing its integration with other OpenStack services.
What is OpenStack Watcher?
At its core, Watcher is an OpenStack service that helps you analyze your cloud’s resource usage and identify opportunities for improvement. It operates through a robust architecture as shown below:

Key Capabilities
- Collecting Metrics: Watcher utilizes various data sources for metric collection. In Openstack environments, it leverages Prometheus datastores, allowing it to gather real-time and historical performance data, such as CPU utilization, memory consumption, and I/O rates of virtual machines and compute nodes. This integration with Prometheus enables Watcher to use gnocchi and ceilometer data from a common backend.
- Analyzing and Proposing Actions: Based on administrator-defined goals and strategies, Watcher analyzes the collected metrics. Watcher’s audit component triggers strategy execution. Strategies are algorithms designed to identify specific optimization opportunities, such as weight strategies (e.g., CPU_USAGE or RAM_USAGE) to balance workloads, or consolidation strategies to reduce the number of active compute nodes. These strategies generate action plans which are a sequence of proposed actions.
- Executing Action Plans: Once an action plan is approved (either manually or through automated configuration), Watcher can activate tasks in other OpenStack services. For instance, to balance CPU utilization across compute nodes, Watcher might propose live migrations of virtual machines, which are then executed by Nova (OpenStack Compute) without service interruption. Other actions could include resizing VMs or re-balancing storage.How Watcher Works (high level)
Implementing Watcher Strategies
Let’s follow two typical workflows implementing Watcher strategies from Horizon (UI) and the CLI.
Example UI Workflow: Workload Stabilization
The Watcher Workload Stabilization strategy can be used to move VM instance workloads when the physical host CPU or RAM utilization percentage exceeds the specified threshold. The instances that are migrated should cause the workload for the host to approximate the average workload of all the Compute nodes in the OpenStack cluster.
Prerequisites
- Operational Openstack on which Watcher is running
- At least two instances (VMs) that run on different nodes
- Dashboard service (Horizon) installed
- Admin privileges
Procedure
- Login in the Horizon dashboard with credentials which would enable the Admin role in one or more projects.
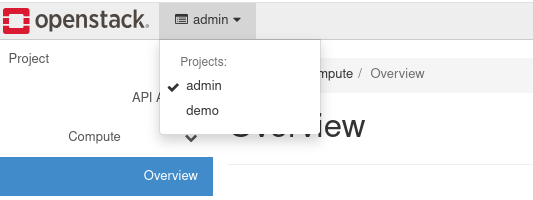
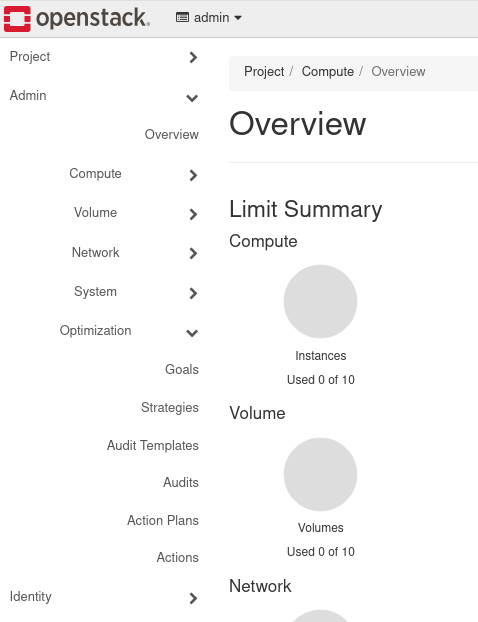
- Make sure you have the Administration menu enabled by selecting the project where you have the Admin role assigned in the Projects tab:
- In the Admin menu a new panel Optimization should be available:
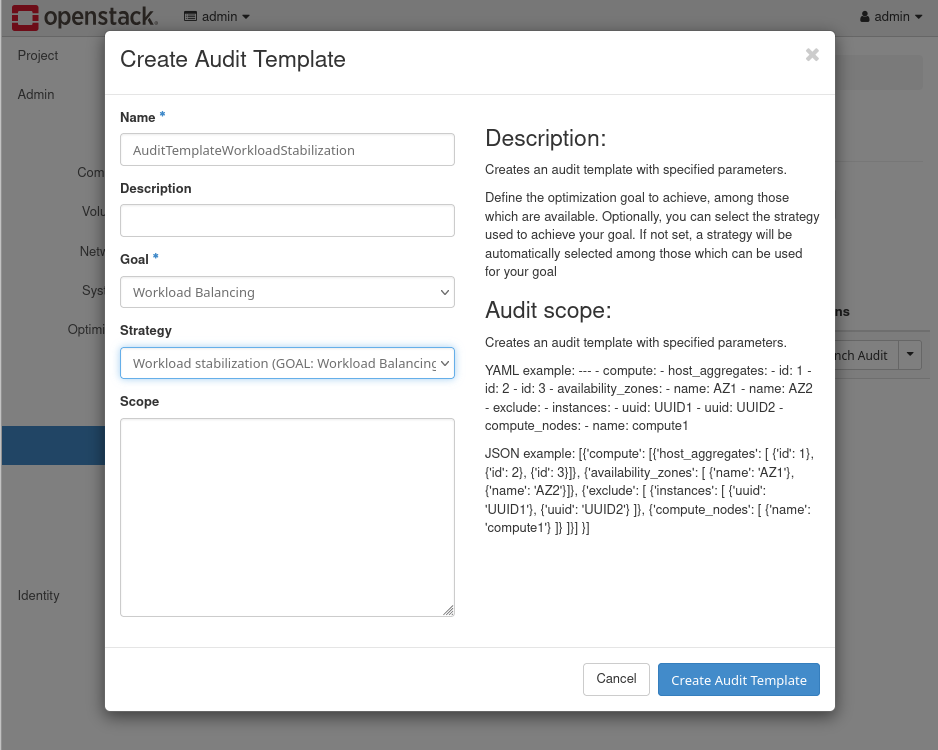
- In the Audit Templates panel, click on the Create Template button. This will open a Create Audit Template window. Add a new Audit Template called AuditTemplateWorkloadStabilization with the goal Workload Balancing and the Strategy Workload stabilization. Further information on the Workload stabilization strategy is available in the Workload stabilization strategy reference.
- In the Audit panel, click on the Create Audit button. This will bring up the Create Audit window. Select the AuditTemplateWorkloadStabilization Audit Template, the CONTINUOUS Audit Type. In the Interval field, set the value to 180.
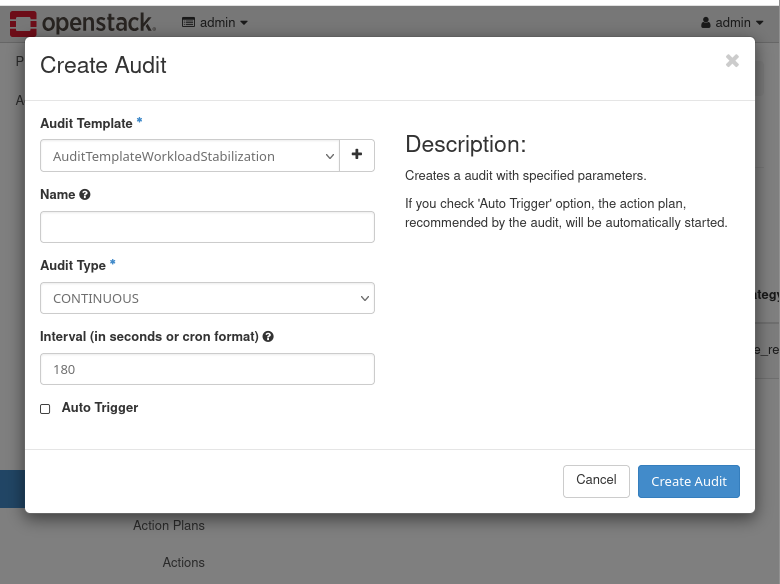
Click on the Create Audit button and a new Audit will be shown. - Click on the UUID of the Audit listed and you will find the Action Plans created for the new Audit. Given the low usage of resources in the instances created for the example workflows, the initial Action Plan will not have real actions.
- Increase CPU consumption in one of the created instances (VMs). You can view the list of instances in Horizon by selecting the Instances panel from the menus: Admin → Compute → Instances. Click on the name of one of the instances, and go to the Console tab for that instance. Log in with cirros user and the gocubsgo password, and run following command:$ dd if=/dev/random of=/dev/nullAfter a few minutes, the CPU usage of the edited instance should increase up to close to 100%. This increase will be seen in the instance metrics.
- Go back to Audit panel by through menu options: Admin → Optimization → Audit. Click on the UUID of the continuous Audit. The next execution of the Audit should generate a non-empty Action Plan with a RECOMMENDED status. Depending on specific resources, it may take one or two executions of the Audit to create this non-empty plan.
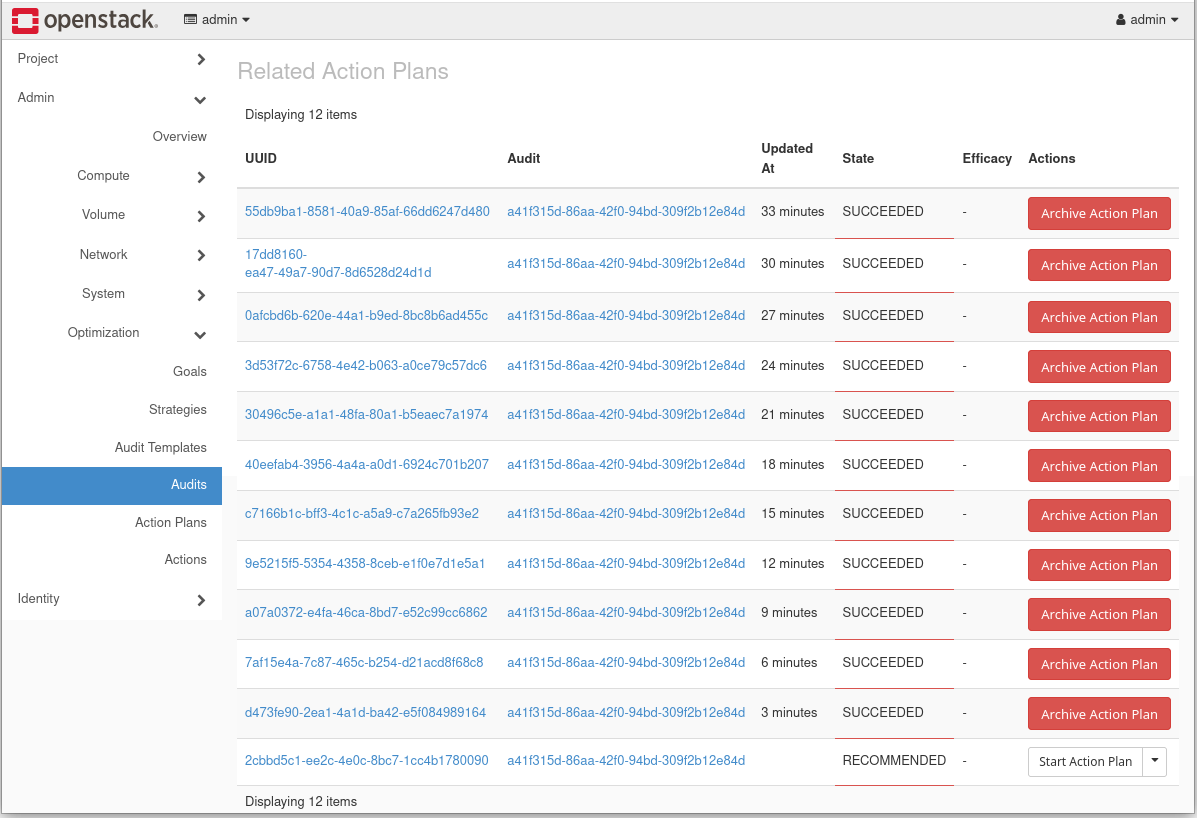
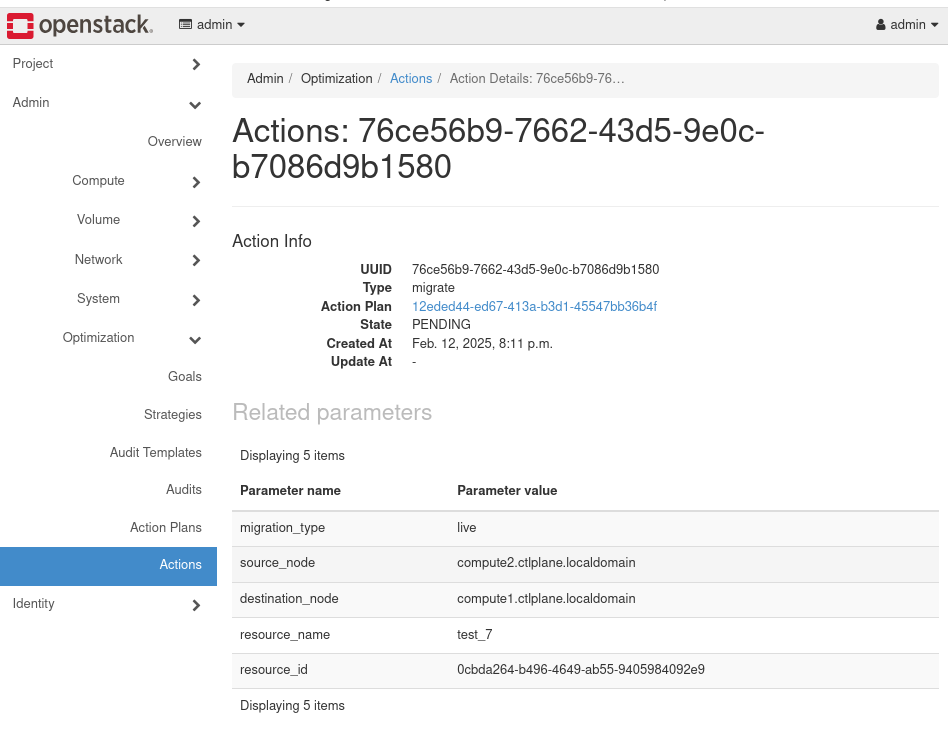
- Click on the RECOMMENDED Action Plan, there should be a Migrate Action listed. Click on the Action to see the related details. The resource_name field should match the name of the instance where you logged in and ran the dd command.
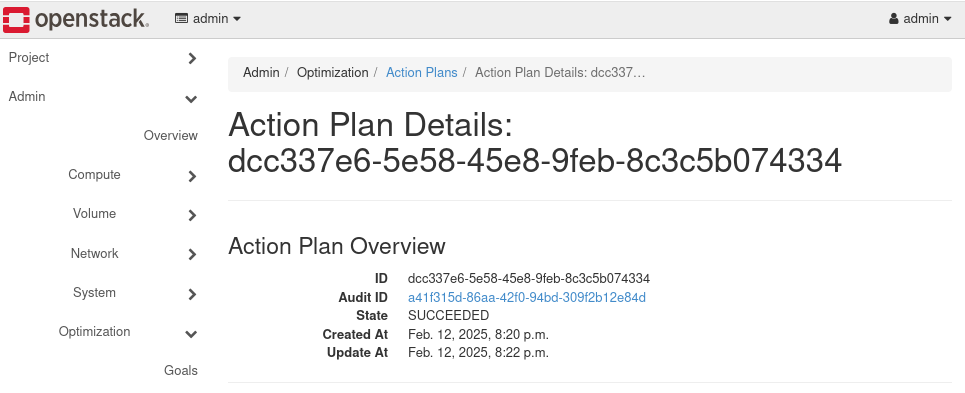
- Go back to the list of Action Plans, and click the Start Action Plan button for the RECOMMENDED plan. Click on the Action Plan UUID to track the status until it goes to SUCCEEDED.
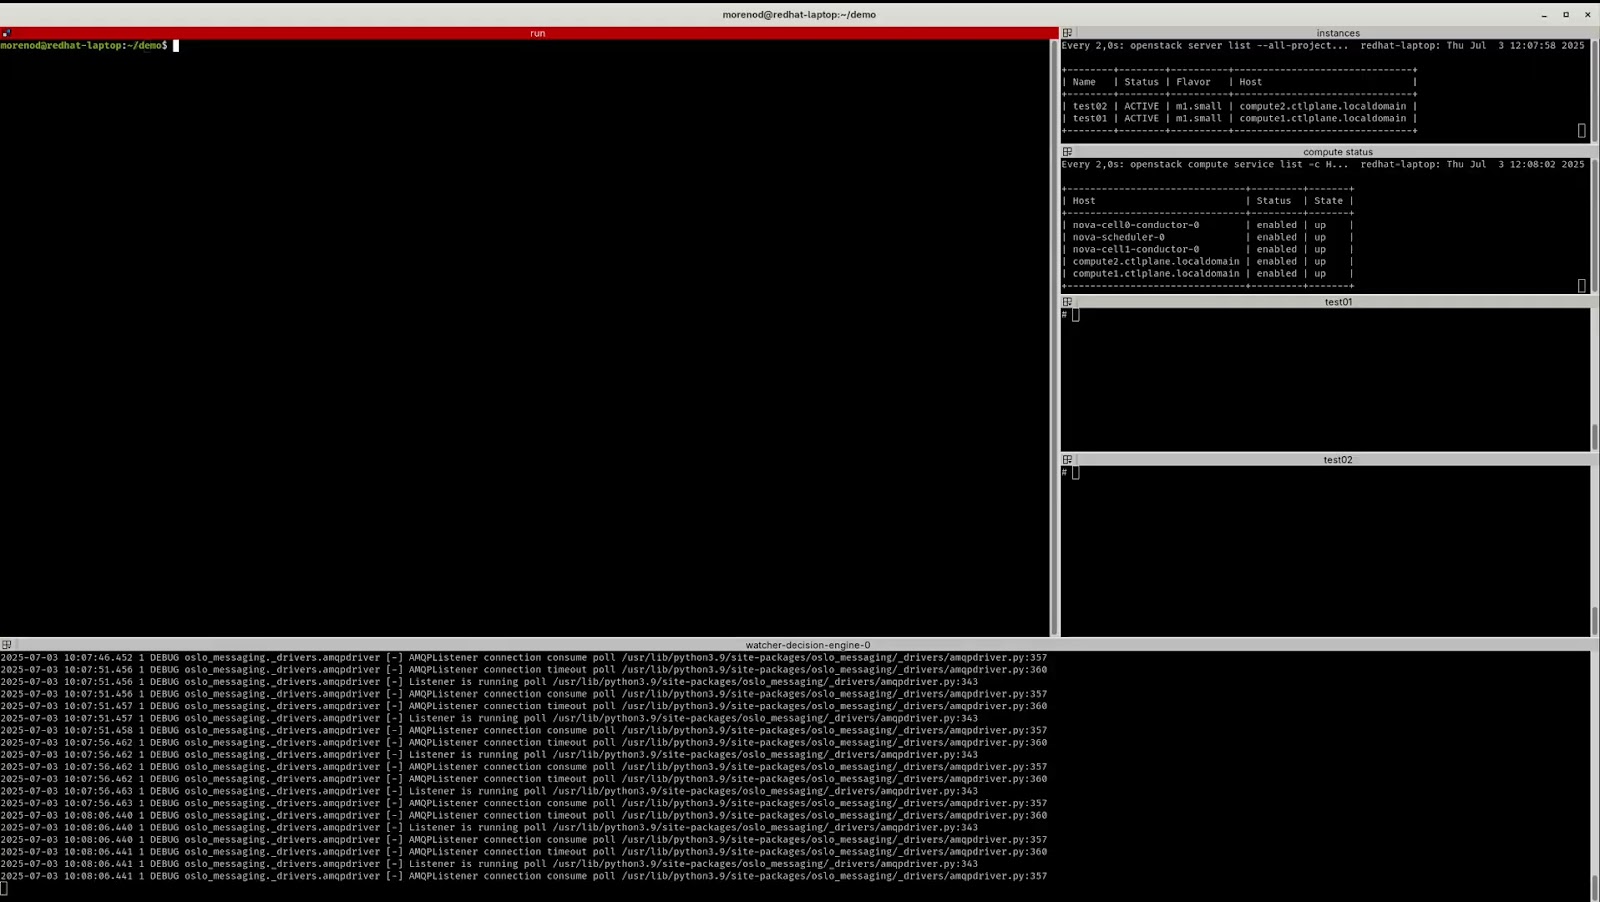
- Check the distribution of the test instances over the hosts using the openstack server list –long command. You should see that the instance where the load was increased, has moved.
$ openstack server list --long -c Name -c 'Host' --project demo

+--------+-------------------------------+

| Name | Host |

+--------+-------------------------------+

| test_7 | compute1.ctlplane.localdomain |

| test_6 | compute2.ctlplane.localdomain |

| test_5 | compute2.ctlplane.localdomain |

| test_4 | compute2.ctlplane.localdomain |

| test_3 | compute2.ctlplane.localdomain |

| test_2 | compute2.ctlplane.localdomain |

| test_1 | compute2.ctlplane.localdomain |

| test_0 | compute2.ctlplane.localdomain |

+--------+-------------------------------+ - Stop the CONTINUOUS Audit from the Audits panel and select Cancel Action. If this option is not available from Horizon in your environment, you can execute it using the CLI:
$ openstack optimize audit update <audit uuid> replace state=CANCELLED
Example CLI Workflows: Host Maintenance, Zone Migration and Workload Balancing
The Host Maintenance strategy allows the cloud Administrator to set a host on maintenance mode disabling nova-compute service and live migrating all instances to any other compute node. This strategy could be useful when we find any error on the compute node and we want to remove workloads from the compute nodes pool to investigate the error.
The Zone Migration strategy works in a similar way to Host Maintenance one, but adding granularity to the process, allowing the cloud Administrator to select more than one node to evacuate, and selecting the destination node of the instances to be evacuated. The main difference with the Host Maintenance strategy is that source node nova-compute service is not disabled during the process.
The Workload Balance strategy execution is similar to the one executed using the UI, but using the command line to select different values on the audit parameters.
Key Benefits for OpenStack Users
Watcher brings a multitude of advantages to your OpenStack environment, helping you achieve greater efficiency and control:
- Intelligent Workload Optimization: Watcher helps optimize workload distribution, effectively mitigating infrastructure hotspots caused by imbalanced workloads post-creation. This ensures your compute nodes are balanced in terms of key resource metrics like CPU, RAM, and disk I/O, preventing resource starvation on heavily loaded nodes and underutilization on others.
- Reduced Operational Costs: By dynamically balancing workloads and enabling more efficient infrastructure resource usage, Watcher can lead to:
- Lower hardware requirements: Optimal utilization can extend the lifespan of existing hardware or reduce the need for premature scaling.
- Reduced utilities: Efficient resource allocation minimizes power consumption and cooling demands for your data center.
- Fewer hotspots and congestions: Proactive optimization prevents performance bottlenecks that can lead to service outages.
- Node Consolidation: When possible, Watcher can identify opportunities to consolidate workloads onto fewer compute nodes, allowing idle nodes to be powered down, further reducing operational expenditure.
- Enhanced Performance: A well-balanced infrastructure, facilitated by Watcher, can sustain higher workload densities and consistently meet increasing demands. This translates to improved application responsiveness and a better end-user experience, supporting business growth.=
- Automated or Manual Intervention: Watcher provides the flexibility to operate in fully automated, partially automated, or manual modes. Administrators can configure audit templates to execute action plans automatically once generated. Alternatively, they can review and explicitly approve or reject proposed action plans, providing granular control over changes to the cloud infrastructure.
- Customizable Policies and Strategies: You can define specific policies for workload distribution, resource allocation, and VM placement based on your organizational requirements and compliance best practices. Watcher’s strategy engine allows for the development and integration of custom optimization algorithms. Different parameters can be passed to audits, with each strategy defining its own set of configurable parameters, enabling fine-grained control over optimization goals.
- Event-Based Audits: Watcher supports event-based audits that can be triggered by webhooks. This allows for specific goal/strategy execution based on alerts generated by monitoring systems like Prometheus rules. For example, a Prometheus alert indicating high CPU usage on a specific compute node can automatically trigger a Watcher audit to rebalance VMs on that node.
If you’re looking to enhance your OpenStack environment’s efficiency and performance, OpenStack Watcher offers a compelling solution. Explore the official OpenStack Watcher documentation to delve deeper into its architecture, configuration, and available strategies, and see how this intelligent optimization service can transform your cloud operations.
- Unlock Peak Performance and Efficiency: The Power of OpenStack Watcher - September 18, 2025