)
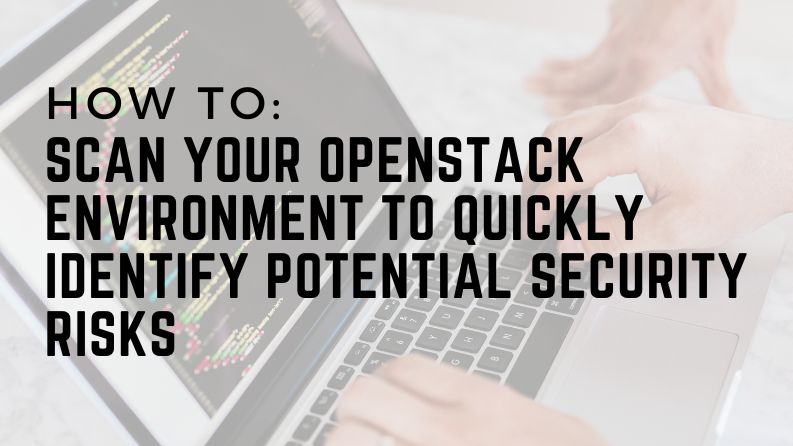
In this article, we will discuss a script I developed myself that will automatically scan your OpenStack environment to quickly identify potential security risks and generate reports in HTML and JSON formats. You can access the script on GitHub and experience it now!
Prerequisites Admin Authorized OpenStack RC File
For the script to run smoothly, you must be able to access your OpenStack environment with admin privileges. For this:
1. Download Admin RC File:
– Log in to the OpenStack Horizon interface with the admin user.
– In the “Project” or “Identity” tabs, you will find an option like “Download OpenStack RC File” or similar.
– Download this file to the machine where you will run the script.
2. Identify RC File as Source (source):
In the terminal:
source admin-openrc.sh
– This command sets the environment variables required for the openstack CLI.
– For testing, you can verify your authorization by running a command like openstack server list --all-projects. If you can see server information from all projects when you run the command, you have admin privileges. Otherwise, you will only see the servers from the projects you are authorized for.

Script’s Basic Working Logic
When you run the script:
1. Project Selection:
OpenStack projects in your environment are listed, and you are asked which ones you want to scan.
2. Data Collection:
Data consisting of instances, security groups, buckets, and user roles in the projects you specify are collected.
3. Security Analysis:
A comprehensive analysis is carried out on the collected data:
– Sensitive Data and Special Patterns:If the metadata contains keys such as admin_pass or special patterns such as BEGIN RSA PRIVATE KEY, it is marked as critically sensitive. This allows you to immediately see real credential leaks. You can also specify these patterns yourself in the “config.json” file and reduce the false-positive rate.
– Full Access to Management Ports:
If full open access to ports SSH (22), HTTPS (443) or RDP (3389) with 0.0.0.0/0 is detected in the security group rules, the finding is “critical.” This means that your management interface is public.
– Public Bucket Write Access:
Public write is checked as well as public read. When public write access is found, the finding is “critical,” which means that attackers can upload malicious data.– Outdated/EOL Images:
Patterns like “trusty,” “14.04,” or especially “eol,” “endoflife” indicate EOL (end of life) images. These images cannot receive security patches, which is a critical risk that requires immediate intervention. You can also edit these patterns in “config.json” according to your environment.
– Admin User Control:
Users with admin roles are compared with a reliable “allowed list.” If it is not in the allowed list, it is reported as “high” risk; if “test” is in the username, it is reported as “critical” risk. Thus, unauthorized or suspicious admin users are immediately detected, and the false-positive rate is reduced.
– Public Access to Management Network:
If the management network contains external and public IP, the finding is marked as “critical.” This means that management traffic is exposed to the outside world.
4. Reporting:
Findings are classified according to severity levels (critical, high, medium, and low) and reported in HTML and JSON formats.

Tool start

Running the Script
After setting environment variables:
python tool.py --report-file myreport.html --json-report --threads 10
– --report-file:Allows you to specify the name of the detailed HTML report.
– --json-report:The JSON report is suitable for your automations. It sorts all findings according to their severity level.
– --threads: Improves performance by running network and bucket queries in parallel.

Understanding and Interpreting the Report
HTML Report:
Severity Legend:
– Critical: Serious risks that require immediate intervention (e.g., full open access to management ports, EOL images, test users who should not have admin privileges, etc.).
– High: High-risk situations that need to be solved in the short term (such as public read bucket).
– Medium/Low: Medium and low priority improvements.
Search Box:
By searching for specific words (e.g., “admin_pass” or “0.0.0.0/0”), you can quickly access relevant findings.
Tooltips:
In security group rules, you can see details such as direction and port range with a tooltip.
JSON Report:
– Report.json contains issue lists separated by severity. By integrating it into your CI/CD processes, you can create automations such as “stop deployment if there is a critical finding.”

How Should You Respond to the Findings?
Critical Findings: Take immediate action.
– If there is full open access to management ports, add an IP restriction.
– If a private key leaked, delete it from the metadata and change keys.
– Turn off public bucket write access.
– Replace EOL images with current images.
– Disable or remove the user who fits the suspicious pattern and is not on the admin and allowed list.
– Isolate the management network from external access.
High/Medium/Low Findings:
It includes optimizations that you can fix over time. For example, changing a public read bucket to private, narrowing the ANY protocol rule to specific protocols, or disabling suspicious but non-admin users.
Customization and Development Tips
– Keywords, Patterns and Lists:
Adapt the SENSITIVE_KEYWORDS, CREDENTIAL_KEYWORDS, SUSPICIOUS_USER_PATTERNS and ALLOWED_ADMIN_USERS values in config.json to your environment. You can flexibly identify suspicious usernames using regex patterns.
– Performance:
Speed up queries in large environments with the --threads parameter. Make further improvements by adding asynchronous calls or additional cache mechanisms if needed.
– False-Positive Mitigation:
Allowed admin users list minimizes false positives by adding admin accounts you trust to the exception. Again, you can reduce the risk of false alarms by clearly defining the name of the management network or IP ranges.

config.json file
Conclusion
This script takes a comprehensive look at your OpenStack security assessments. It clearly presents both serious risks (full open access to management ports, EOL images, public write bucket, suspicious admin users, sensitive private key patterns) and less urgent but important improvement opportunities. Thanks to both HTML and JSON formats, you can use it in manual review and automation stages and continuously improve your security.