)
The 2 a.m. page. It always starts the same way.
A tenant files a ticket. “Instances are slow to boot. Sometimes they just fail.” No pattern. No error they can name. Just slow, and the instance stuck at BUILD, never leaving it.
We run one region out of SGN/VN. More than 1000+ compute nodes, thousands of VMs. On a bad night, one stuck instance sends us to the nova-api logs first, and the request is right there. 202 Accepted, a fresh instance UUID, a clean timestamp. nova-api did its job: it accepted the request and moved on.
But accepting the request is not building the instance. That work happens somewhere else, and it happens after the response goes out, nova-api cast a message to nova-conductor, nova-scheduler picked a host, nova-compute pulled an image, called neutron-server for ports, called cinder-api for a volume, with keystone validating tokens the whole way down. RabbitMQ carried every RPC hop between them.
Six services. Control nodes and computes, more of them than you’d like. One tenant’s bad night.
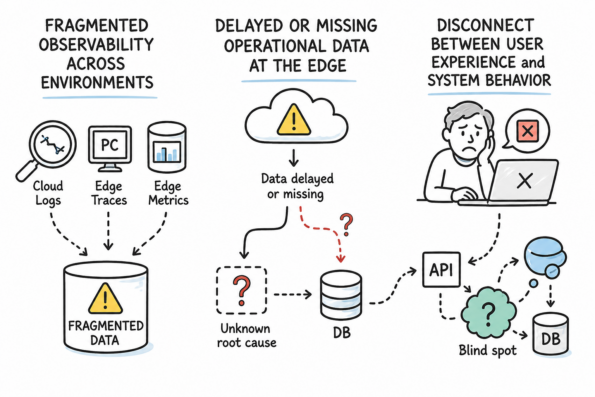
And our evidence? Six separate log files, each with its own request-id, none of them agreeing on what “the request” even was. So we did what every operator does past midnight. We started “SSH-ing”.
Here’s how that night actually went:
nova-api first, the request landed on the API, so that’s where we start. Except “the API” isn’t one box. It’s several, behind a VIP, and HAProxy decides which one takes the call. We don’t know which. So we pick one and go in.
kolla-ansible runs every service as a container, but the logs land on the host, under /var/log/kolla/<service>/. We grep the instance UUID straight off disk.
ssh control-01grep <instance-uuid> /var/log/kolla/nova/nova-api.log
Nothing. Wrong node. The VIP sent this one somewhere else. Try the next.
ssh control-02grep <instance-uuid> /var/log/kolla/nova/nova-api.log
There. 202 Accepted, the UUID, a request-id — req-…. A thread to pull.

Then the thread snaps. nova-api‘s next move was an RPC cast to nova-conductor, over RabbitMQ. And nova-conductor writes its own request-id. Nothing carries nova-api‘s req- across the bus. So we can’t grep the same string. We fall back to what we’ve got: the instance-id, and the clock. Note the second nova-api handed off. Open the nova-conductor log. Scroll to that window.
grep <instance-uuid> /var/log/kolla/nova/nova-conductor.log
The UUID rides along through the build, so it’s in there. nova-conductor ran nova-scheduler and picked a host, one of the thousand-plus compute nodes. Say compute-42. Now the work leaves the control plane entirely.

Onto the compute node. Different machine, new SSH.
ssh compute-42grep <instance-uuid> /var/log/kolla/nova/nova-compute.log
And the failure is finally in front of us:
Build of instance <uuid> aborted: Volume did not finish being created

But that’s only nova-compute‘s side of it. nova-compute asked cinder-api for a volume and gave up waiting. It has no idea why cinder-volume was slow, only that it timed out. The nova-compute log does hand us one thing we need: the volume’s UUID. The real cause is one more service away, in cinder-volume, which runs back on the control nodes. So we turn around, SSH back to the control plane, and start over on the cinder-volume logs, with that volume UUID as the only key we’ve got.
ssh control-01grep d65b2a13-b2e5-4c95-873e-0f031307820d /var/log/kolla/cinder/cinder-volume.log
Wrong node again, probably. Try the next. Eventually it turns up:
Error scheduling d65b2a13-b2e5-4c95-873e-0f031307820d from last vol-service: hcm10@sgn10san05
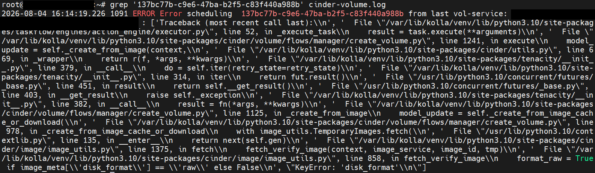
There’s the root cause. The storage backend, hcm10@sgn10san05, couldn’t place the volume. But look at what it took to get here. Four SSH sessions. Three services. Three different request-id schemes, and a pile of timestamps matched by eye. And we still don’t know the one thing that decides how we escalate: is this one unlucky tenant, or is every volume create in the region failing right now? To answer that, we’d go count errors across the cinder-volume logs on every control node. By hand.
By now it’s past 3 a.m.
That’s the old way. Isolated logs, manual correlation, and a root cause you find by 4 a.m. if you’re lucky.
We wanted a different way. One where the cloud tells us what happened, in order, in one place. No grep. No guessing.
The design decision
We had a choice to make, and it’s the choice that makes or breaks the whole thing.
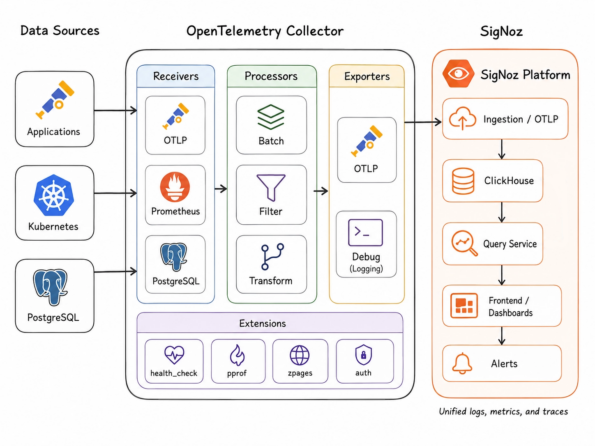
OpenTelemetry was the easy call. It’s vendor-neutral. Instrument once, send anywhere, in one wire format (OTLP). No lock-in. No black boxes.
SigNoz was the next easy call. It ingests OTLP natively and puts traces, logs, and metrics under one roof. The collector forwards; SigNoz correlates. That was the “single place to look” we wanted.
Then we hit the wall.
Generic OpenTelemetry auto-instrumentation is good. It traces requests, WSGI, database drivers. The common stuff. Point it at OpenStack and you get… disconnected fragments. Because OpenStack doesn’t fail at the common stuff. It fails at the boundaries generic tooling can’t see:
- oslo.messaging RPC over RabbitMQ: The moment nova-api casts to nova-conductor, the trace dies. Generic instrumentation doesn’t inject context into an RPC envelope.
- keystone.middleware: The server side of every authenticated request. Generic tooling doesn’t continue the trace from the inbound traceparent.
- eventlet, futurist, native threads: OpenStack moves work off the request’s execution context constantly. The active trace context gets dropped in the handoff.
- taskflow: Nested workflows with retries and reverts. A flat trace can’t model them.
These aren’t edge cases. They are the request lifecycle. An OpenStack request is an HTTP call that becomes an RPC message that spawns async work that runs a TaskFlow. If your instrumentation can’t cross those four boundaries, you haven’t instrumented OpenStack. You’ve instrumented the first 50 milliseconds of it.
So the design decision was this: use OpenTelemetry as the language, but teach it to speak OpenStack.
That’s exactly what opentelemetry-openstack does. Seven instrumentation packages, each owning one boundary:
| Package | The boundary it owns |
| openstacksdk | CLIENT spans on SDK REST calls; injects context |
| keystoneauth1 | CLIENT spans on session HTTP + token/discovery calls |
| keystonemiddleware | SERVER span; extracts context and continues the trace |
| oslo-messaging | PRODUCER -> CONSUMER across RabbitMQ RPC |
| oslo-service | Keeps context alive across threads/futurist/eventlet |
| oslo-log | Stamps trace_id onto every log record |
| taskflow | Spans the workflow tree: tasks, retries, reverts |
Every seam uses the same W3C traceparent propagator, so injection on one side and extraction on the other always agree. The result is one trace that runs from the client SDK, through keystone auth, across the RabbitMQ RPC hop, into nova-conductor, into nova-compute, and out to neutron-server and cinder-api. Unbroken.
Here’s the shape of it:
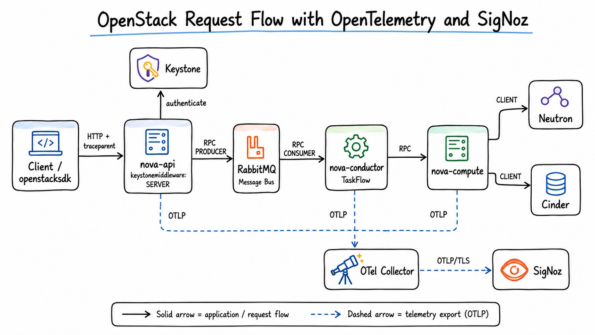
Solid lines are the request. Dashed lines are the telemetry. One trace, one backend, no grep.
The deployment strategy
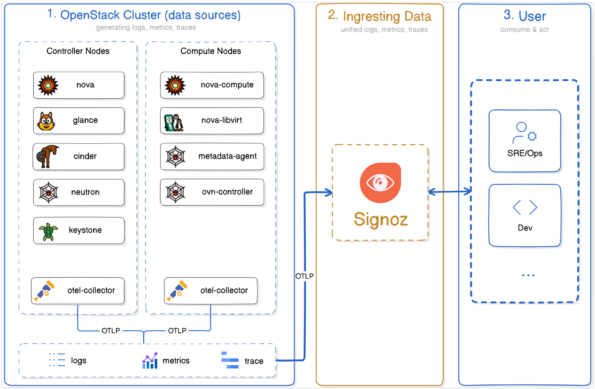
Great instrumentation is worthless if rolling it out means rebuilding every image or forking every container. So the second design decision mattered as much as the first: how do you get this into a live openstack cloud without touching the images?
You don’t edit the images. You don’t fork them. You bind-mount the agent in and let PYTHONPATH do the rest.
That’s kolla.otel. It adds three commands to the kolla-ansible CLI:
kolla-ansible otel-instrument # inject the agent + OTEL_* env, recreate containers
kolla-ansible otel-rollback # strip it all back out, cleanly
kolla-ansible otel-collector # stand up (or tear down) a per-host collector
No image rebuilds. No forks. No black boxes. And otel-rollback means you can always walk it back.
Four steps to an instrumented cloud
No ceremony. Four steps, and you can undo the last one.
- Write the config once, in globals.yml:
The same file kolla-ansible already reads. Leave otel_exporter_endpoint empty and kolla.otel runs in local-collector mode: a collector per host, forwarding to SigNoz.
otel_auto_instrument: true
# otel_exporter_endpoint: http://<central-collector>:4317
otel_deployment_environment: production
otel_exporter_protocol: http/protobuf
otel_image_registry: “daipham3213”
otel_image_version: “0.12.3”
otel_languages:
python:
image_component: “otel-autoinstrumentation-openstack”
Already running a central collector? Set otel_exporter_endpoint to it instead and skip step 2. Services export straight there.
- Deploy the collectors, and verify them first.
kolla-ansible otel-collector -i multinode
Stand up the telemetry sink before anything sends to it. Confirm it’s receiving and forwarding to SigNoz. No point instrumenting services to talk to a collector that isn’t there yet.
- Instrument the services.
kolla-ansible otel-instrument -i multinode
The real work: stage the agent, inject the env, recreate each present container. Watch the service names and resource attributes land in SigNoz.
- Roll back if needed.
kolla-ansible otel-rollback -i multinode
Strips the injected env, drops the bind-mount and label, recreates each container to its pre-instrumentation state. Pass the same –config you instrumented with to undo exactly what you applied. No black boxes. What went in comes back out.
That’s the recipe. The rest of this section is why it’s safe to run.
How the instrument module is designed
The temptation with a tool like this is to bury the logic in Ansible YAML and hope. kolla.otel doesn’t. It splits into layers, and the split is the point.
- A dependency-free config model (kolla_otel.config). Plain Python dataclasses that validate your –config file: right protocol, known languages, no unknown keys (typos are rejected, not silently ignored). No Ansible, no third-party imports. It can be unit-tested with the standard library alone.
- A translator (kolla_otel.extravars). Turns that validated model into the role’s otel_* variables. One job, testable in isolation.
- One source of truth for the overlay (kolla_otel.instrumentation). Pure functions that compute exactly what instrumenting a container means: the OTEL_* environment, the read-only agent bind-mount, and the managed-env label. Nothing else decides those.
That last layer is the clever bit. The Ansible role’s inject.yml and the pure-Python overlay compute the identical result. A test parses the role’s defaults/main.yml and asserts the two copies can’t drift. So whether instrumentation is applied by the otel-instrument command or re-applied automatically during a plain deploy, the container comes out the same. No black boxes, no surprises.
Two design choices earn their keep:
The env is declarative: Every key the tool injects is recorded in a container label (kolla_otel.managed_env). On the next run, anything in that label that’s no longer in your config is removed from the container. Drop a variable from globals.yml and it actually disappears. It doesn’t linger. The layering is deliberate too: common OTEL_* exports first, then deployment-wide extras, then the service’s identity, then per-service overrides, and language activation (PYTHONPATH) last, so the thing that makes the agent load can never be clobbered by anything above it.
The recreate preserves what matters: This is where most “just recreate the container” schemes break. kolla.otel reads the running container back and re-applies its privileged flag, pid/ipc mode, capabilities, and healthcheck (converting Docker’s nanoseconds to the seconds kolla expects). That’s the difference between nova_compute surviving the recreate unchanged and it coming back broken.
And for teams that want instrumentation to survive native deploy/reconfigure without re-running anything, there’s an optional kolla_container action plugin (otel_auto_instrument: true). It’s off by default and fails open, unless it’s explicitly enabled and an endpoint is set, it passes every task through untouched, and any error computing the overlay is logged as a warning while the original task runs unmodified. Instrumentation is best-effort. It must never break a deploy.
What one run actually does
otel-instrument runs a playbook, per host, in this order:
- Resolve the endpoint. If you set otel_exporter_endpoint, that’s it. If you left it empty, the role gathers network facts and points instrumentation at the per-host local collector on the host’s own api_interface address. The endpoint is always well-defined.
- Validate. Every targeted service must map to a known language, or the run stops before touching anything.
- Discover what’s actually here. It asks the container engine which of your target containers exist on this host (kolla_container_facts). Only those are touched, which is exactly why the same command is safe to run against controllers and compute nodes alike. A compute node simply has no keystone to instrument, so it skips it.
- Stage each language once. Pull the auto-instrumentation image and copy its agent into /etc/kolla/opentelemetry/<language>, but only if the image ID changed since last time. Unchanged image, no-op.
- Inject per service. Build the merged env/label/volume set for each present container and recreate it through kolla-ansible’s own kolla_container machinery.
otel-rollback is the same playbook with otel_action=rollback: strip the managed env, drop the bind-mount and label, recreate to the pre-instrumentation state, and once nothing mounts the agent anymore, delete the staged artifacts from the host.
When your kolla-ansible is too old for plugins
Here’s a real-world snag. Older kolla-ansible releases (<=18.8.0) don’t load external commands from the kolla_ansible.cli entry-point namespace. On those, kolla-ansible otel-instrument simply doesn’t exist. Dead end.
kolla.otel ships a way around it: a standalone kolla-otel console script. Same commands, same playbooks, minus the otel- prefix:
kolla-otel instrument -i multinode
kolla-otel rollback -i multinode
kolla-otel collector -i multinode [--remove]
It’s a self-contained cliff app that registers those three commands imperatively. It never relies on entry-point discovery, which is the exact thing broken on old releases. The commands are the same classes the CLI plugin uses; they still run the same playbooks and still need a working kolla-ansible install underneath. Only the dispatch is made version-independent. Use whichever your release supports. They’re equivalent.
The performance question
Every operator asks it, and they’re right to: what does this cost me?
Be honest about where the cost comes from instrumentation isn’t free, and pretending otherwise is how you get a 2 a.m. page of a different kind:
- Span creation and export. Every traced call allocates a span, records attributes, and eventually ships it. Batched, this is cheap per request, but it’s not zero, and it scales with request volume.
- Context propagation across concurrency. The whole reason oslo-service exists is to carry trace context across threads, futurist pools, and eventlet greenlets. That plumbing runs on hot paths. It’s necessary; it’s also work.
- Log enrichment. Stamping trace_id onto every record touches every log line, not just the interesting ones.
- Startup import cost. The PYTHONPATH agent loads and patches libraries at interpreter start. It’s a one-time hit per process, invisible at steady state, but it does lengthen container (re)start.
The real trap isn’t the CPU. It’s cardinality. Attach an instance UUID, request-id, project, user, or full URL to a metric and you don’t add a data point. You multiply your time series until the backend buckles. Keep high-cardinality identifiers on spans and logs, where they belong and are stored individually. Keep them off metrics. And be deliberate about instrumenting the highest-volume, lowest-value paths: high-frequency RPC and per-TaskFlow-task spans are exactly where cost outruns insight.
Then there’s sampling. The default is parentbased_traceidratio at 1.0: every trace, always. That’s a lab setting, and it’s the single biggest knob you own. In production, sample at the head on the source (otel_traces_sampler_arg, tunable per service) and tail-sample at a gateway if you want to keep the rare failures head sampling would drop. Aggressive sampling hides the incidents you most want to see; capturing everything buries you in storage and network. Pick the middle on purpose.
One thing we won’t do is hand you a number. The repositories don’t publish benchmarks, and anyone who quotes you a universal “X% overhead” for OpenStack tracing is guessing. It depends on your request mix, your sampling, and your attribute choices. So measure it yourself. Baseline CPU, memory, and p50/p95 latency with instrumentation off. Turn it on for a representative subset. Compare. Scale only when the delta is one you’d sign for. That’s not caution for its own sake. It’s the only honest way to know.
What it looks like when it works
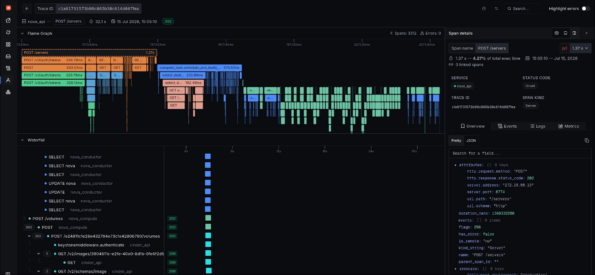
Back to the 2 a.m. page. Same slow boot. Different night.
The ticket comes in. This time we don’t go host to host. We open SigNoz, search the instance UUID, and there’s the trace. The whole request as one flame graph. We follow it down to cinder-volume, and the volume create span is red.
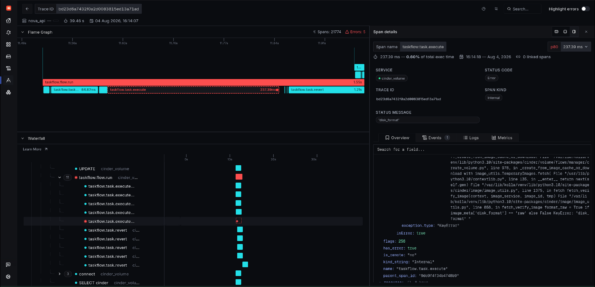
We click it. The error stacktrace is right there on the span: volume creation failed and stopped. The trace keeps going past it, and that’s the tell. nova-compute never heard the bad news. It still shows the instance at BUILD, waiting on a volume that already errored out and is gone.
The correlated cinder-volume logs, same trace_id, say Error scheduling d65b2a13-b2e5-4c95-873e-0f031307820d from last vol-service: hcm10@sgn10san05. There’s the message, sitting on the span, not buried in a log file on another host.
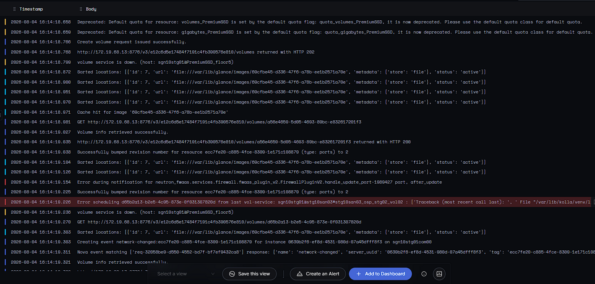
The ticket, the trace, the error, in that order. No more grep. No more guessing.
That’s the new way.
Key takeaways
- The pain isn’t missing logs. It’s disconnected ones. OpenStack requests fan out across six services and two transports. Isolated logs can’t follow them.
- OpenTelemetry is the language; OpenStack needs a dialect. Generic instrumentation dies at RPC, keystonemiddleware, eventlet, and TaskFlow. The seven opentelemetry-openstack packages own exactly those boundaries.
- Zero-code rollout is what makes it real. kolla.otel bind-mounts the agent and sets PYTHONPATH: no image rebuilds, no forks, clean rollback. The injection is declarative (a container label tracks what it manages), idempotent, and preserves the settings that keep nova_compute working. On kolla-ansible releases too old for CLI plugins, the standalone kolla-otel script does the same job.
- Roll out like an operator. Lab first. Collectors first. Pin versions. Sample deliberately. Redact secrets. Then go wide.
- Know the cost before you scale it. Overhead is real, cardinality is the trap, and sampling is your biggest knob. Nobody’s universal “X% overhead” number is yours. Baseline, instrument a subset, measure, then commit.
- SigNoz is the single pane. OTLP in, correlated traces/logs/metrics out. Grep becomes three clicks.
Go deeper
Test it in a non-production OpenStack cluster first. Then let your cloud tell its own story.

- We Made an OpenStack Cloud Tell Its Own Story - August 17, 2026