)
Virtualised infrastructure is always far behind bare metal in network performance, especially for workloads that process large volumes of small packets or highly variable traffic.
This is not a subjective impression.
It is a technical limit that has been measured repeatedly and widely documented.
When a system must handle from hundreds of thousands to tens of millions of packets per second, the issues become obvious:
- Throughput struggles to scale with NIC bandwidth, sometimes losing more than half of the theoretical capacity of the hardware.
- Packet rate (PPS) hits a ceiling very early due to guest overhead, host context switching, and similar factors.
- Latency spikes when security features are enabled, or when many guests contend for CPU and incur high steal time on the same host.
- Packet drops appear at high load, and the platform cannot credibly commit to a 99.99% packet-rate SLA with near‑zero drop, the way “big clouds” often claim.
As a result, critical workloads such as firewalls, IDS/IPS, and telco components (5G UPF, CGNAT, vRouter), load balancers, streaming applications, and real‑time edge systems are often not trusted to run on traditional domestic cloud platforms.
So the question is: are we simply using outdated hardware?
In reality, no.
We run modern servers and NICs.
Some providers even have to “grit their teeth” and invest in expensive 100G switching just to compensate for the loss.
So why do VMs on cloud in Vietnam (and in many places across the region) still suffer from this?
The uncomfortable truth is: the data plane of many cloud solutions today is not designed for packet processing at scale.
Our approach
Instead of trying to “optimise a little more” on top of an old foundation, we chose a more fundamental direction:
We re‑architected the OpenStack data plane end‑to‑end to serve packet processing to telco standards.
This platform is built on:
- DPDK (Data Plane Development Kit)
- Socket locality (NUMA‑aware)
- Multi‑queue optimisation
- Hardware offload
- Real‑time computing
What matters is that this is not simply “turning on DPDK”.
We created a completely new compute layer: High‑Performance Compute Hosts (HPN) — designed for high packet processing, latency‑sensitive workloads, and minimising context switching as far as possible.
Verification methodology
It is easy for a provider to publish a set of infrastructure SLIs.
Those numbers may sometimes be credible, but they are not guaranteed to have been collected using rigorous, standardised measurements.
That is why we spent significant time studying the tools commonly used by telcos and large cloud vendors.
We standardised test cases and made them repeatable, reducing the risk of “misalignment” during acceptance phases of real projects.
In this article, we use a combination of T‑Rex, iperf, and Grafana k6.
The reason for using multiple tools can be summarised as follows.
A common mistake in evaluating network performance is relying entirely on iperf3.
iperf3 is heavily influenced by the TCP stack and application behaviour.
By contrast, telco and real‑time systems care far less about the application layer.
They care about only three things: how many packets per second the infrastructure can process, what the latency is, and whether drop exceeds the threshold.
That is why we use Cisco T‑Rex as an additional benchmarking tool, to standardise the test cases in this write‑up.
T‑Rex can generate L2/L3 traffic (reducing application bias), precisely control packet size, flows, and PPS, and measure the system’s true forwarding capacity.
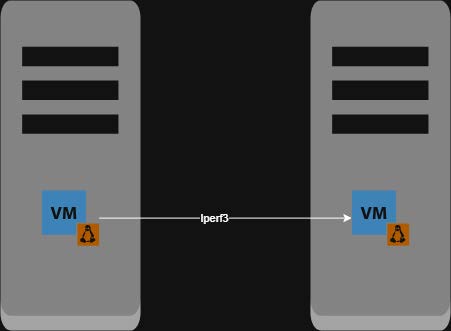
Below are the three main benchmark models used.
Each block maps to a physical compute server connected via a bond of two uplink ports.
To avoid going too deep, I will not draw the full carrier flow from switching to uplinks.
Iperf Layer 2 (iperf path stays within a single network namespace):
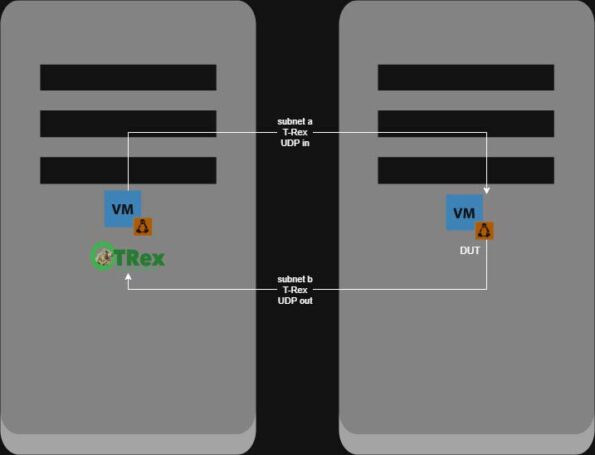
T‑Rex Layer 3 (subnets A and B are in separate network namespaces):
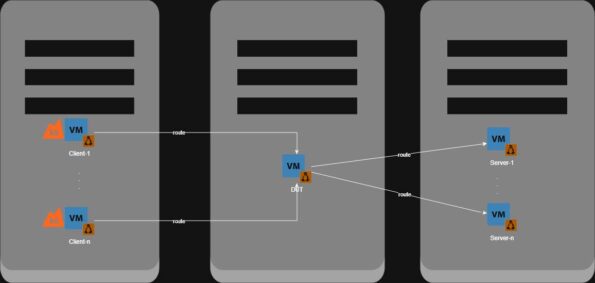
Grafana k6 Layer 3 (ingress from client and egress to server are in separate network namespaces):
In other words, this is how telcos and major vendors validate NFV capability in infrastructure.
We will attach evidence from iperf and Grafana k6, which are available from real customer PoC tickets.
The three performance pillars to evaluate
Before measuring, we need to be precise about what we are measuring.
Instead of simply saying “faster”, we evaluate against three core factors:
Throughput — Packet Rate — Latency
These three directly determine workload experience and stability.
From a cloud engineer’s perspective, there is sometimes a trade‑off between them, but trade‑offs and tuning are out of scope for this article.
Throughput — When the virtual network truly reaches line rate
In real environments, high throughput is not just about “hitting a peak”.
It is about sustaining performance under load.
In one AZ in Hanoi, we used 10G NIC/ports, with a DUT of Cisco Catalyst 8000V (16 vCPU / 32 GB RAM) running on KVM.
The system achieved:
- ~6.4 Gbps sustained throughput (Layer 3) under load with small 64B packets.
We also benchmarked other providers in Vietnam and observed roughly:
- ~2.3 Gbps (Layer 3) on typical KVM VMs in a production cluster that already had load, under comparable conditions (overlay virtual networking, excluding VLAN or public network).
Notably, 6.4 Gbps Layer 3 is already close to the theoretical limit of vhost/virtio in a 10G environment.
iperf3 Layer 2 evidence:
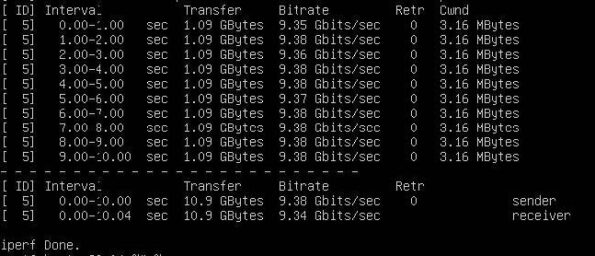
That virtualised network bandwidth loses no more than 10% is something rarely seen in the domestic cloud market, even though it is referenced in Government Circular 1145.
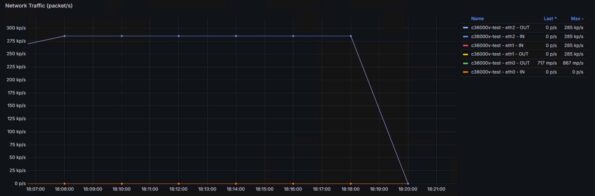
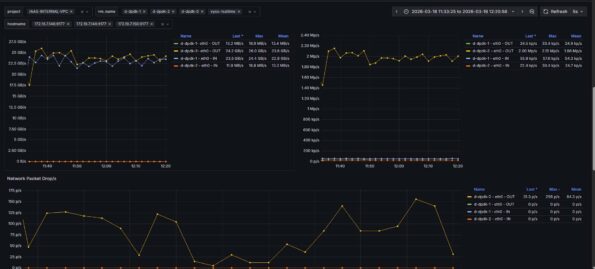
Grafana k6 Layer 3 evidence:
Ingress and egress curves are almost identical, with virtually no drops.
Throughput can be computed as:
Throughput = packet size × (pps subnet 1 + pps subnet 2)
In another AZ in Ho Chi Minh City, the infrastructure uses 25G NIC/ports.
When running a real workload with iperf3 multi‑queue from many small VMs (each VM only 4 vCPU and 4 GiB RAM), placed on different physical hosts, throughput reached:
- ~25 Gbps sustained (Layer 2)
It is important to emphasise that the VMs are on different hosts.
Overlay networks such as VXLAN, Geneve, and similar typically show clear overhead when traffic traverses inter‑host paths.
I can explain the reasons in more detail, but the summary is:
encapsulation and decapsulation are computationally “heavy”, and control can be lost when a cloud cluster has entered production.
In this test, our VMs did not exhibit “collapse” as load increased. Traffic remained stable, with no severe degradation.
iperf Layer 2 evidence:
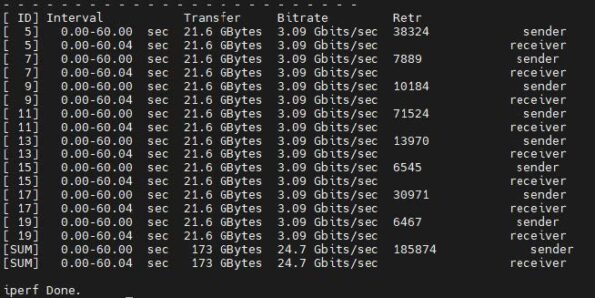
One interesting point is that iperf still shows retransmissions.
However, if retransmissions are relatively high while packet drop is still controlled at around 0.001% of total PPS, then the overhead is more likely in the VM’s network stack.
In other words, the infrastructure’s switching data plane has not yet saturated.
There is still headroom, and customers can reduce retransmissions by allocating more VM resources or optimising the application.
Two key takeaways:
- The data plane is no longer the bottleneck.
- The bottleneck has been pushed up to the application layer — exactly where it belongs.
On traditional cloud platforms, the opposite is often true.
And every time customers “claim” infrastructure issues, providers have to spend additional OPEX to scale the support organisation.
Packet rate — the factor that truly matters
High throughput does not necessarily mean a system is “strong”.
What matters is packets per second — especially for small packets or mixed traffic.
With T‑Rex benchmarks and a DUT of Cisco C8000V, we obtained:
- 64‑byte packets: ~2.2 million packets/s
- Mixed traffic: ~1.5 million packets/s
Compared to a system without DPDK (~240–260 Kpps), that is a 6–8× increase.
Furthermore, we have customised the open‑source project VyOS towards a proprietary NFV product to be released in the near future.
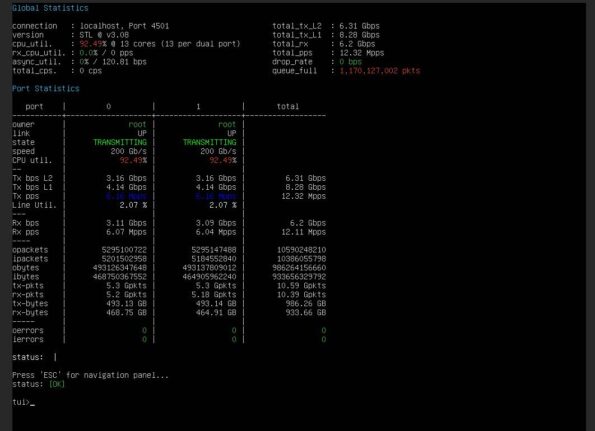
In real T‑Rex UDP tests to a custom VyOS DUT (32 cores, 32 GiB RAM), we achieved results we have never seen from any NFV provider in Vietnam:
- More than 12 million packets/s (12+ Mpps, limited by the traffic generator)
- No packet drops at peak
- CPU utilisation ~92% (stable polling, no jitter)
T‑Rex UDP Layer 3 evidence:
Put into context: many kernel‑datapath KVM environments, even at zero load, can sometimes choke at a few hundred Kpps.
Under production load, VMs running on our HPN hosts average ~6–7 Mpps.
That is effectively multi‑Mpps in a carrier‑grade environment.
This is critical for real‑time and telco workloads, and streaming use cases, where every packet must be handled “in rhythm” and consistently.
Latency and stability — what customers actually feel
If throughput is “top speed”, latency is “real‑world feel”.
In benchmarks on another NFV solution, Check Point R81 (16 cores, 32 GiB RAM):
- Average latency: ~0.16–0.20 ms
- Jitter: ~0.015–0.017 ms
At this level, latency is essentially negligible for most workloads.
By contrast, using a kernel datapath on cloud under the same conditions:
- Latency can rise to 165–270 ms
- Packet drops begin to appear
The difference is no longer “a little better”. It is a difference in kind.
In production, we measured a Check Point NFV firewall using Zabbix:
- Latency sustained at ~0.3–0.5 ms
- CPU steal ~1e-7 (effectively zero)
- No queue build‑up
- No burst drops
Zabbix agent evidence:
Infrastructure latency conclusion:
- Workloads run deterministically
- No random jitter
- No “spikes” that create hard‑to‑debug failures
This is the key factor for real‑time systems.
Production proof (case study)
Benchmarks matter, but production is the final answer.
One customer is running on our infrastructure with a business landing zone serving more than 80,000 users.
Connections are primarily long‑lived tunnels from users to more than 10,000 virtual desktops.
In practice, the customer’s system always faced very high packet rates, unstable latency under heavy load, and uneven jitter.
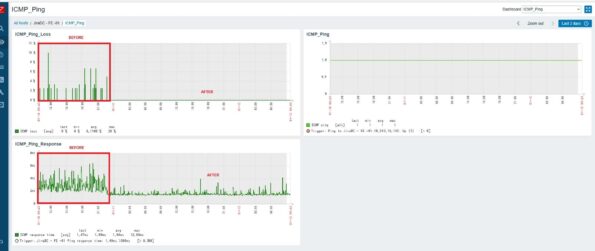
Before migrating firewalls to the HPN service, the customer measured and recorded issues such as PPS ceilings, significant packet drops at high load, sharply degraded end‑user experience, and many support tickets claiming performance problems.
The partner environment runs on 10G NIC/ports.
After moving firewalls to high‑performance hosts (HPN), taking any representative instance (16 cores, 32 GiB RAM):
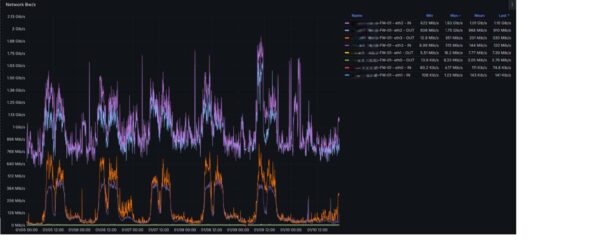
- Throughput increased from ~1.9 Gbps to ~3.4 Gbps (with filtering/validating features enabled on the Check Point NFV)
Grafana k6 Layer 3 evidence:
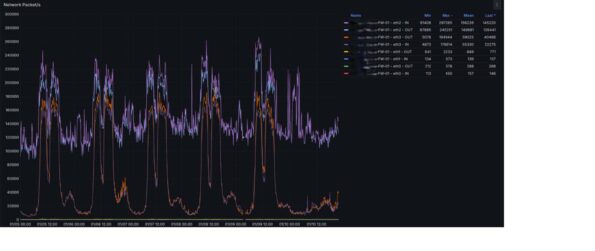
Packet rate increased from ~445K to > 611K pps
 Packet drop reduced to ~0.001% of total packets
 Crucially, vCPUs allocated to the NFV dropped from 48 to 16, yet the two metrics above did not degrade, and latency improved markedly.

Zabbix agent evidence:
The customer’s engineering team concluded:
- Performance nearly doubled
- Latency was low and stable, like bare metal on‑prem
- Compute cost decreased significantly
This is not only a technical improvement. It is practical operational cost optimisation.
Differentiation and regional positioning
A common concern with hardware acceleration such as DPDK is that cloud features might be lost.
We therefore validated end‑to‑end:
- Live migration
- Resize and cold migration
- Security Group CRUD
- Floating IP SNAT/DNAT
- East‑West and North‑South traffic
- Metadata and DHCP
- Volume operations
- Trunking ports
And we can commit that all of these work reliably. You do not need to choose between performance and cloud functionality — you can have both.
Many platforms “have DPDK” but do not achieve comparable results. The difference lies in execution and the depth of customisation:
- CPU pinning and telco‑grade configuration
- NUMA awareness and locality optimisation
- Hardware offloading tailored to the workload
- Correct multi‑queue scaling
- A different way of thinking about the datapath, plus modifications to open‑source projects to meet real requirements
These outcomes cannot be achieved by simply “enabling an option”.
Based on internal microservices benchmarks, comparisons with widely cited research, and production validation with large customers, we believe we have built one of the highest‑performance OpenInfra cloud platforms in Southeast Asia.
More importantly, in the next phase, this platform has the potential to compete directly with international hyperscalers for network‑intensive workloads.
Conclusion
Cloud is no longer the bottleneck.
With the right architecture and careful investment in research into hardware‑accelerated technologies, we believe we can deliver:
- Throughput approaching line rate
- Packet processing at multi‑Mpps scale
- Stable sub‑millisecond latency
- Near‑zero packet loss in production
All of this — on virtualised infrastructure.